Our brand analyst will contact you to get your instance of Synup setup
Through a personalized product demo, our solutions consultant will show you how our product can simplify profile marketing for your business
You will get takeaways on how to convert more customers from your online profiles
With Synup, have your brand be Found, Trusted, Chosen Always
Thank you! Your submission has been received! We will reach out shortly
Oops! Something went wrong while submitting the form. Please confirm your information.
Thank you! Your submission has been received! We will reach out shortly
Oops! Something went wrong while submitting the form. Please confirm your information.
Thank you! Your submission has been received! We will reach out shortly
Oops! Something went wrong while submitting the form. Please confirm your information.
Thank you! Your submission has been received! We will reach out shortly
Oops! Something went wrong while submitting the form. Please confirm your information.
Thank you! Your submission has been received! We will reach out shortly
Oops! Something went wrong while submitting the form. Please confirm your information.
EN
A no-nonsense guide to social media reporting for marketing agencies. Learn what to track, how to present it, and why it matters. Plus, get a downloadable template to streamline your reporting process.
Social Media Reporting Guide For Marketing Agencies + Downloadable Template
Social media isn’t just about posting. It’s about what works, optimizing, and proving ROI. And for agencies, reporting isn’t just a task. It’s how we show value, refine campaigns, and drive results.
The problem? Too much data, not enough insight, and reports clients barely read. A solid reporting process isn’t optional. It’s essential.
This guide breaks down what matters, from key metrics to reports that actually make an impact.
Let’s dive in.
Why Measuring Social Media Engagement Matters?
Agencies need data to prove ROI, refine strategies, and keep clients satisfied. Measuring social media engagement helps answer key questions:
Is the content resonating with the target audience?
Are the right demographics interacting with the brand?
How does social media contribute to business objectives such as lead generation and sales?
Without proper tracking, agencies are operating blindly, unable to optimize campaigns or justify investments.
What to Measure?
Not all metrics hold equal weight. Agencies must distinguish between those that drive business outcomes and those that only look good in reports. Here’s a breakdown of critical social media analytics.
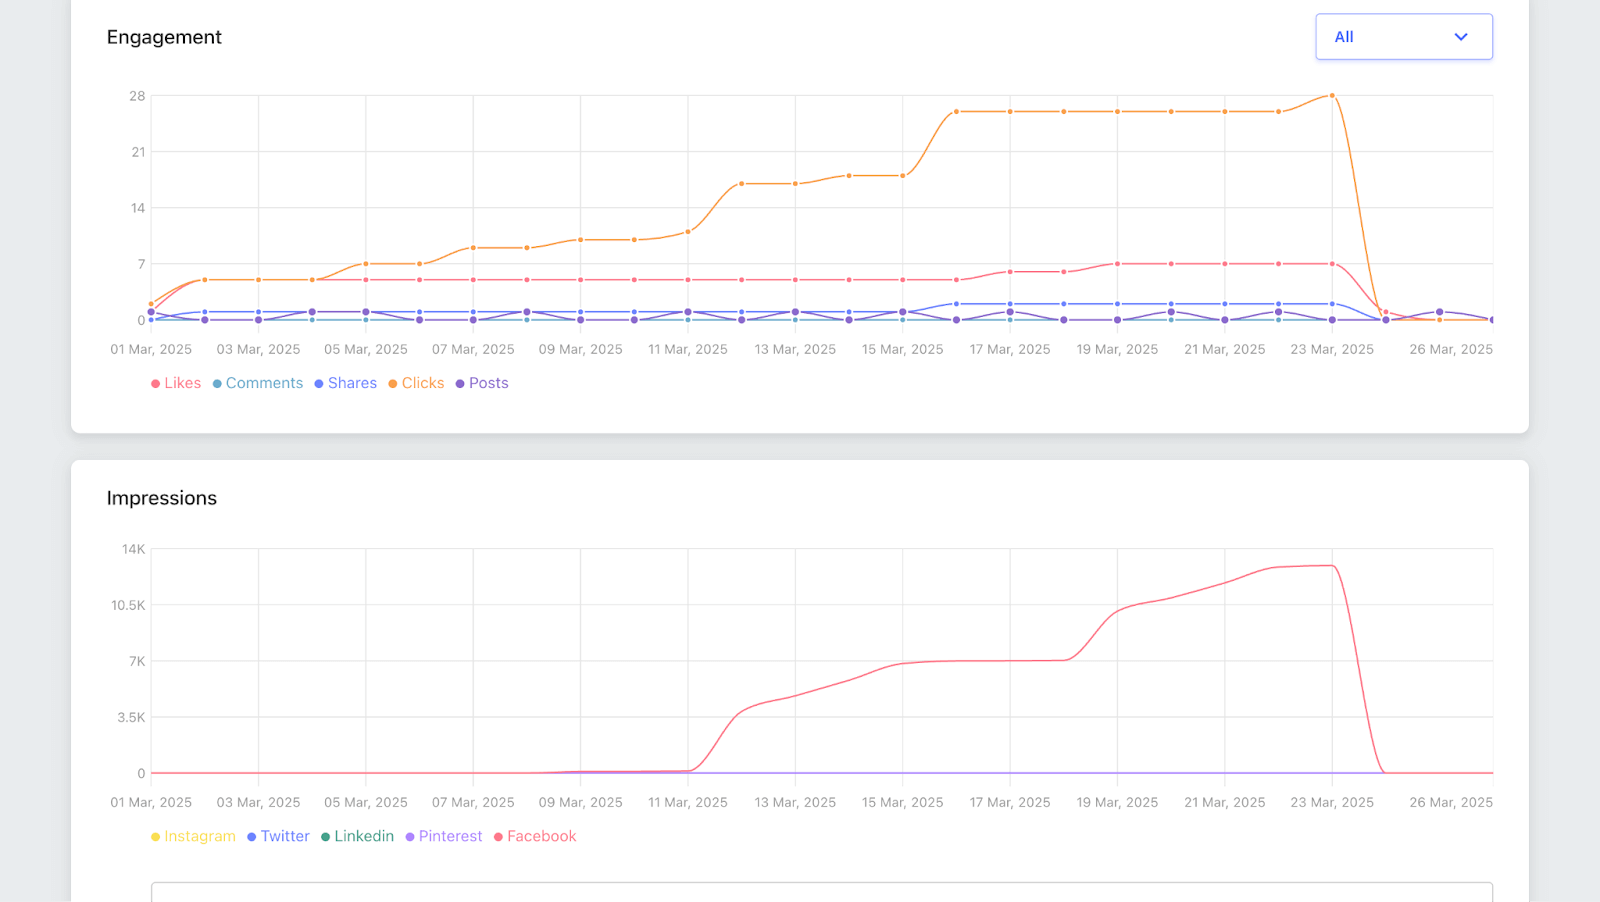
1. Engagement Metrics (Audience Interaction)
Engagement is a direct indicator of how well content resonates with the audience.
Likes, Comments, Shares – These show audience involvement, but they need to be analyzed in context. Are they from the right audience, or are they just casual users?
Engagement Rate – Measures total interactions (likes, shares, comments) relative to reach or followers. It’s useful but should not be the sole metric for success.
Click-Through Rate (CTR) – Shows whether content is compelling enough to drive users to a website, landing page, or product.
Social Media Referrals – Tracks website traffic originating from social media channels, helping determine which platforms drive the most engagement.
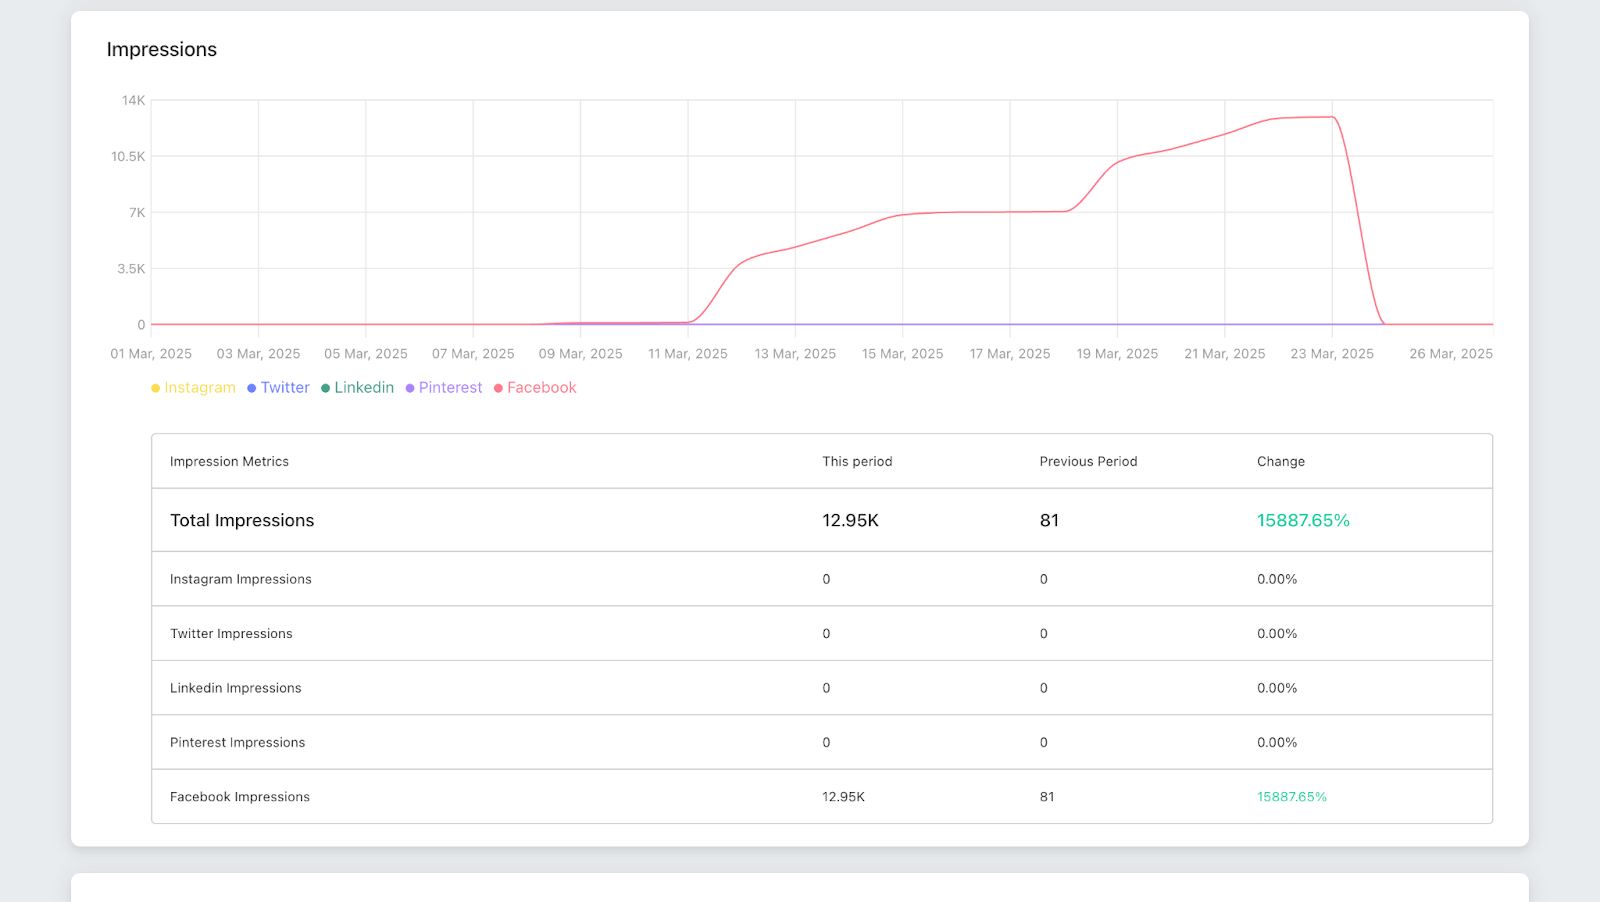
Reach & Impressions
Reach – The number of unique users who saw a post. Important for brand awareness campaigns.
Impressions – The total number of times a post appeared on users’ feeds. Helps gauge how often content is viewed.
Virality Rate – The number of shares divided by total impressions, indicating how well content spreads organically.
3. Conversion Metrics
Agencies must align social media efforts with business goals:
Website Traffic & UTM Tracking – Determines which social media platforms are driving traffic to the client’s website.
Lead Generation Metrics – Tracks the number of sign-ups, downloads, or inquiries originating from social media.
Conversion Rate – The percentage of visitors who take a desired action (purchase, booking, form submission).
Cost Per Conversion – Measures the efficiency of paid campaigns in generating leads and sales.
4. Audience Demographics & Behavior
Understanding audience composition is key to refining targeting:
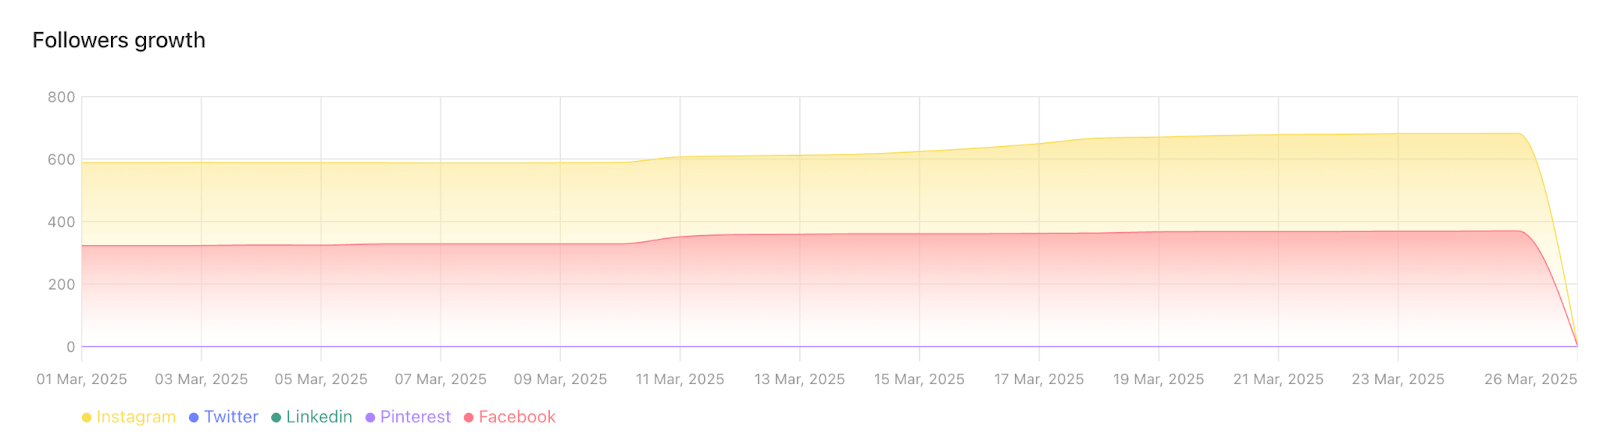
Follower Growth & Retention – A growing audience is great, but agencies should focus on engaged followers rather than passive numbers.
Demographics – Age, location, gender, and interests help tailor content strategies.
Active Hours & Posting Schedules – Identifies when audiences are most engaged.
5. Sentiment Analysis & Brand Perception
Mentions & Share of Voice – Tracks how often a brand is mentioned compared to competitors.
Sentiment Analysis – Evaluates whether social media mentions are positive, neutral, or negative.
Customer Service Response Time – A crucial metric for brands using social media as a customer support channel.
Vanity Metrics vs. Real Impact. What Matters?
Follower growth and engagement rates might look impressive, but they don’t necessarily translate to business success. Agencies should prioritize quality over quantity:
A million followers mean nothing if they aren’t engaging or converting.
Engagement rates should be assessed alongside sales, traffic, and lead generation.
Impressions are useful but don’t tell the whole story, what matters is whether the right audience is seeing the content.
How to Measure?
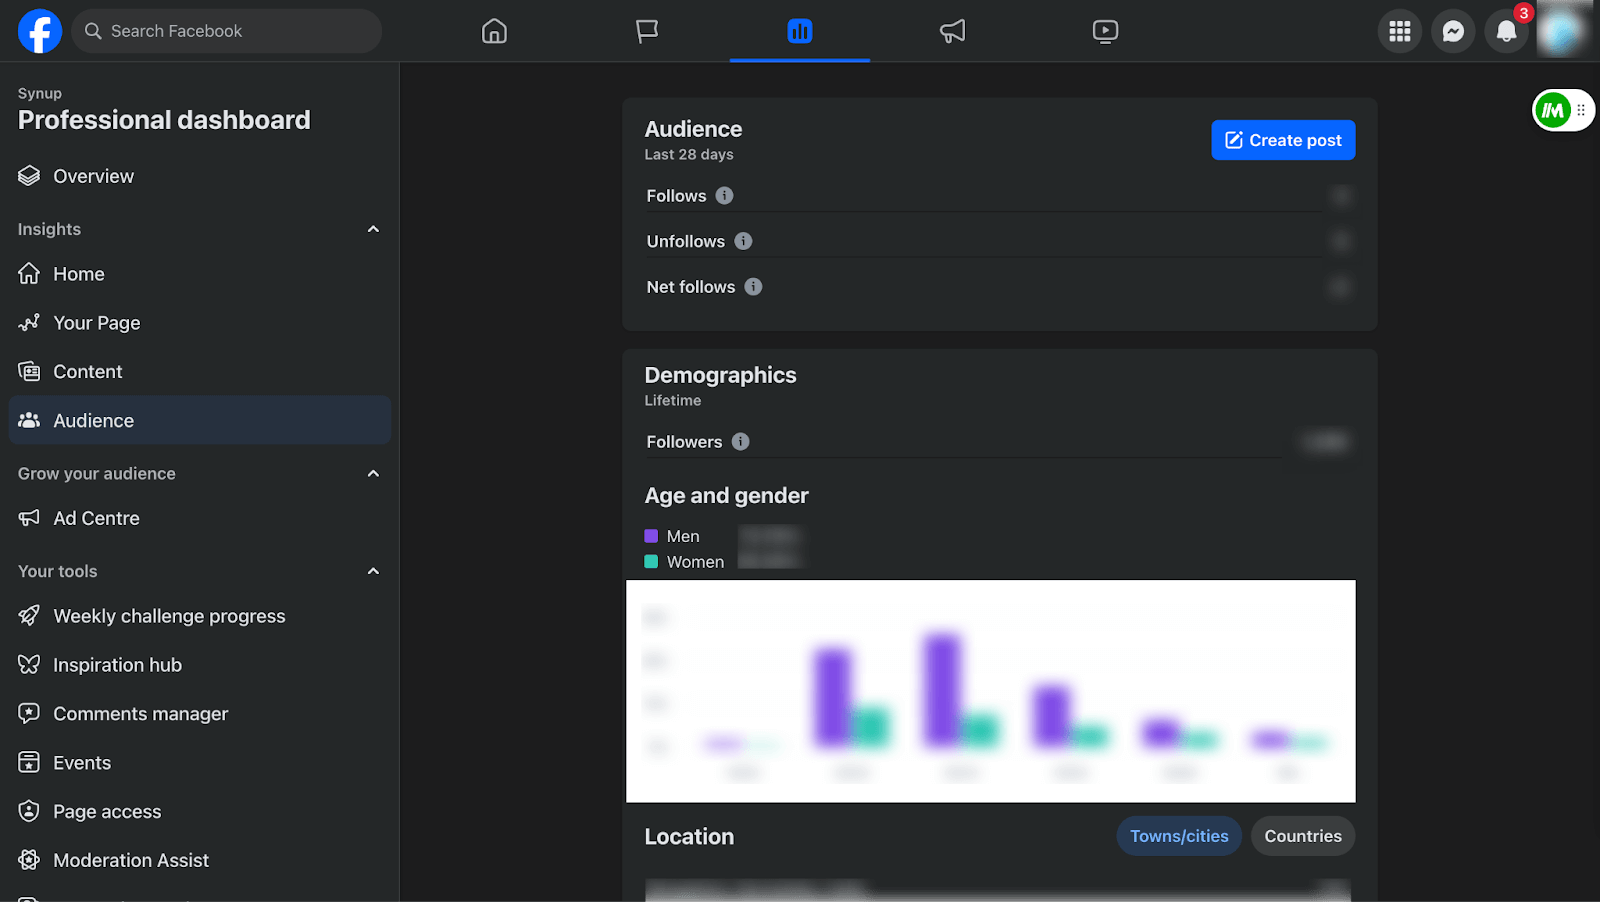
Use Platform Analytics
Most social media platforms provide insights, including Facebook Insights, Instagram Analytics, LinkedIn Analytics, and Twitter Analytics.
Source: Audience Insights, Meta/ Facebook
Source: Perfect Search Media, Google Images
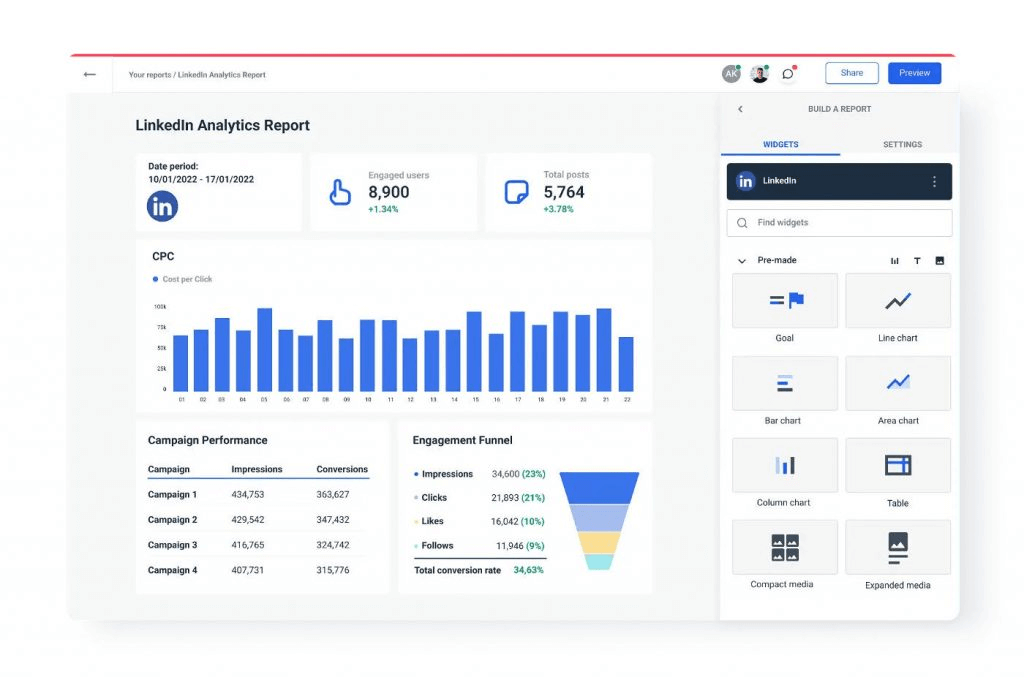
Source: Linkedin Analytics
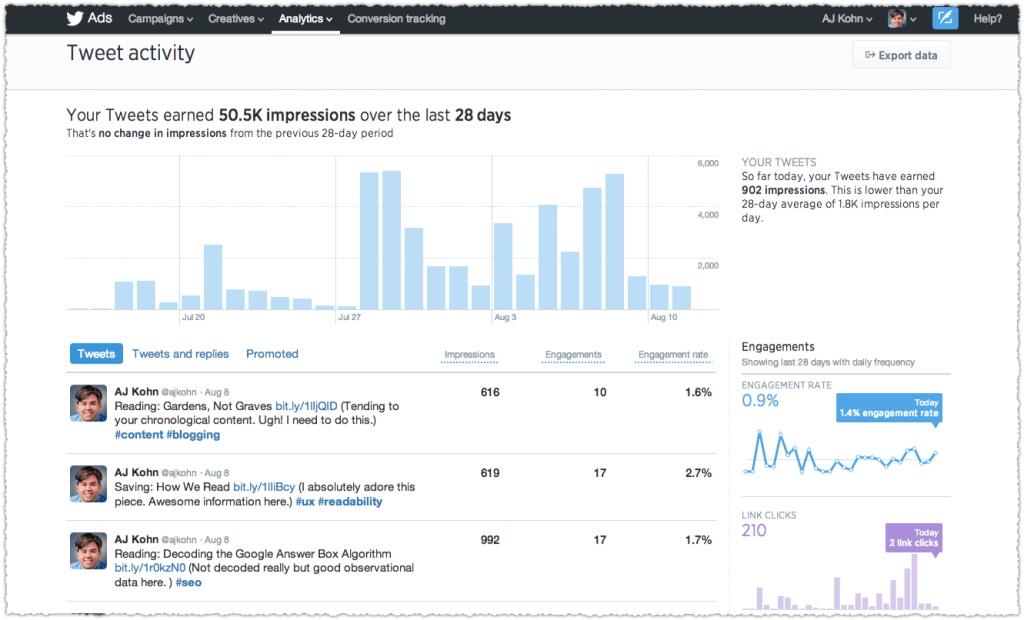
Source: Convince & Convert
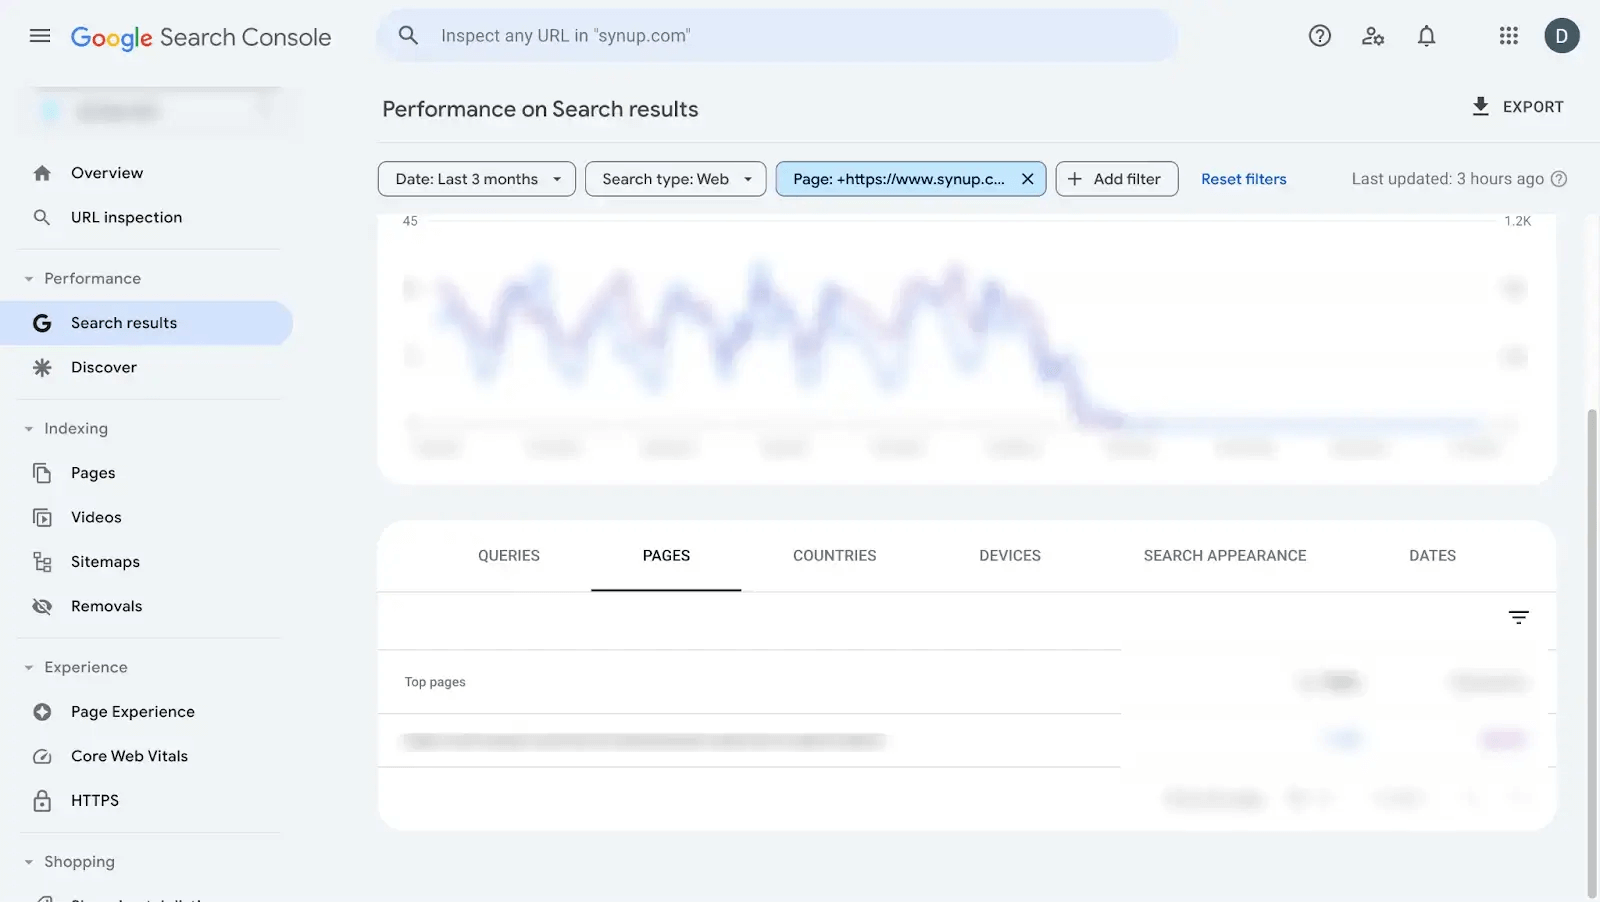
UTM Parameters & Google Analytics
UTM parameters let you track exactly where your traffic is coming from, so you’re not stuck guessing which social posts or campaigns are actually working. By tagging your links, you can see which platforms, content types, and campaigns drive the most engagement and conversions. Instead of relying on vague "social" traffic in analytics, you get clear, actionable data on what’s making an impact.
For agencies, UTM parameters make reporting and strategy adjustments way easier. They help you show clients real, data-backed results, proving which social media efforts are driving actual value. You can also fine-tune content and ad strategies by identifying what’s performing best, making it easier to allocate budget and resources where they’ll get the best return.
How to track your UTM Parameters for your social media links on Google Analytics?
Step 1: Add UTM Parameters to Your Social Media Links
UTM parameters are small tags you add to a URL to track where traffic is coming from. You can create them in seconds using Google’s Campaign URL Builder.
How to create a UTM link:
1️⃣ Go to Google’s Campaign URL Builder → Click Here 2️⃣ Fill in the details:
Website URL: The page you’re linking to (e.g., https://yourwebsite.com)
Campaign Source (utm_source): The platform (e.g., facebook, twitter)
Campaign Medium (utm_medium): Use social for organic posts or paid_social for ads
Campaign Name (utm_campaign): Give it a name (e.g., spring_promo)
Campaign Content (utm_content)(Optional): Use this to track different ad types (e.g., video_ad)
3️⃣ Copy the generated link and use it in your social posts, ads, or bio links.
💡 Pro tip: If the link looks long and ugly, shorten it using Bitly or another URL shortener.
Step 2: Track Your Traffic in Google Analytics
Once your UTM links are live, you can track how they perform in Google Analytics (GA4).
How to check your UTM data in GA4:
1️⃣ Log into Google Analytics 2️⃣ Go to Reports → Acquisition → Traffic Acquisition 3️⃣ Use filters to find your traffic:
Look for Session source to see where visitors came from (e.g., facebook)
Check Session source/medium to see details (e.g., facebook / social)
View Session campaign to track specific campaigns
And that’s how you can make sure you’re tracking your UTM parameters correctly!
Channel Grouping And How Does It Work
1. Helps Prove What’s Working (and What’s Not)
Clients always ask: “Is our Instagram traffic actually converting?” Now, you don’t have to rely on vanity metrics like likes and comments, you can track real traffic, leads, and sales. Just head to GA4’s Traffic Acquisition report and check how much website traffic is coming from Organic Social or Paid Social.
2. Optimize Paid Social Campaigns
Running Facebook Ads, LinkedIn Ads, or TikTok campaigns? Instead of just looking at ad platform data, use GA4 to see how much traffic those ads are actually driving to the website. If the Paid Social channel isn’t performing, it’s time to tweak your targeting, creative, or budget.
3. Identify Which Platforms Drive the Most Traffic
Maybe your agency is pushing content on Instagram, LinkedIn, Facebook, Twitter, and TikTok, but which one is actually sending people to the site? Channel grouping in GA4 breaks this down so you can double down on what works and stop wasting time on what doesn’t.
Helps Make Monthly Reports Much More Valuable
Instead of just showing engagement metrics like reach and impressions, you can now tell your clients:
How many visitors came from social media?
Which platform brought in the most traffic?
Which campaigns led to the most conversions?
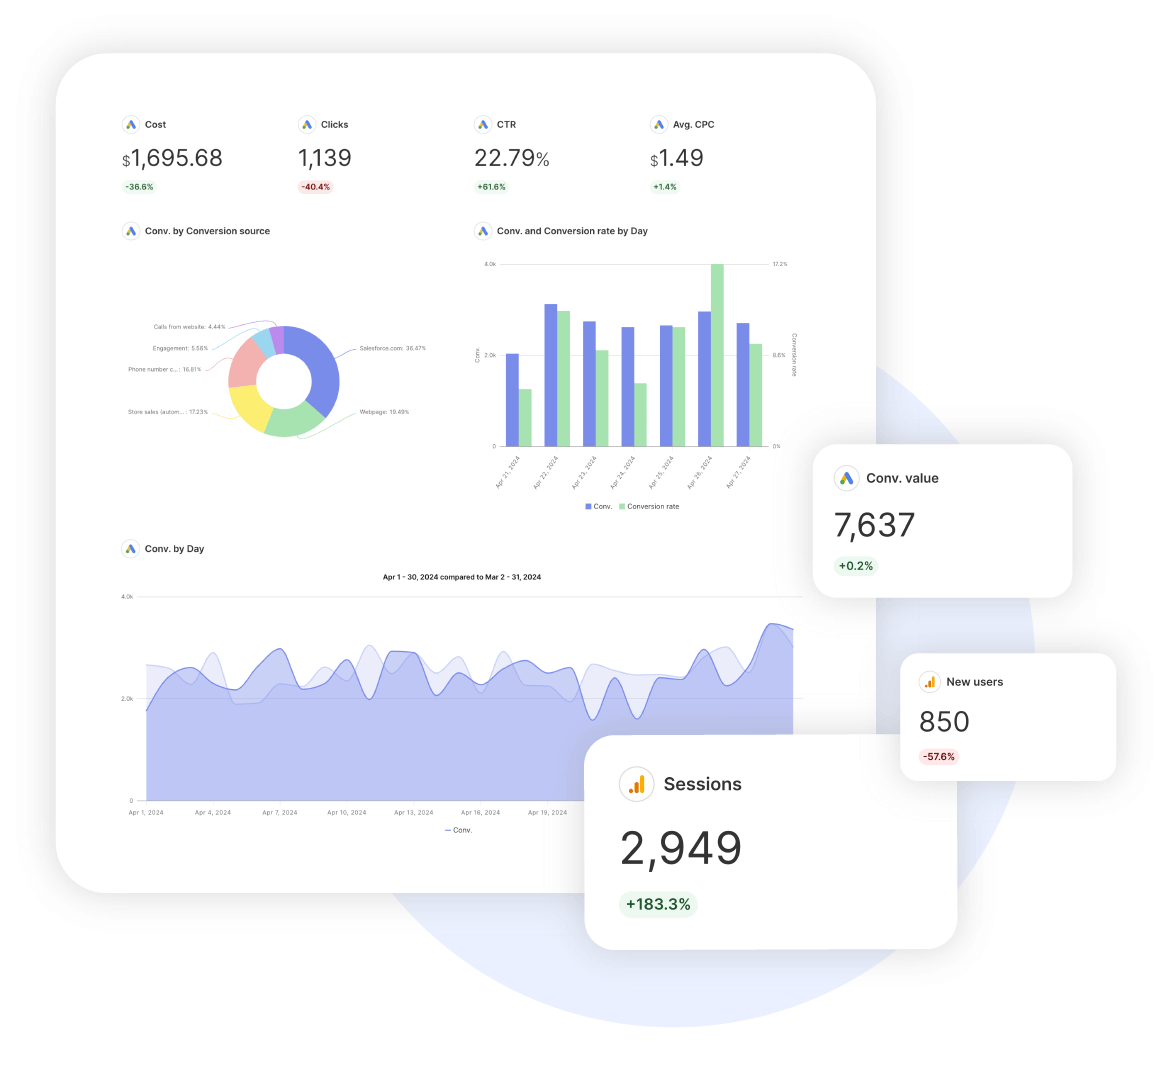
At the same time, with ready-made dashboards that track social performance, web traffic, and ad effectiveness, Synup helps you focus on engagement rates, conversions, follower growth, and sentiment changes based on your goals.
Source: Synup
Some Other Tools That Can Help
Agency Analytics
AgencyAnalytics pulls data from platforms like Google Analytics, Facebook Ads, and SEO tools into a single dashboard, making tracking effortless. You can customize dashboards, automate reports, and get visual insights through graphs and charts. Scheduled reports save time, while real-time tracking ensures you always have the latest data.
Swydo
Swydo is a versatile client reporting tool built for agencies managing PPC and SEO campaigns. Its biggest strength is advanced customization, letting you tailor reports to fit client needs and branding. A digital agency running Google Ads for a multi-location restaurant, for example, can break down ad spend by region, giving clients clear, actionable insights. This level of detail keeps clients engaged and makes reporting more impactful.
How to Structure Social Media Reports
Clients don’t want to sift through pages of fluff. They need reports that get to the point. Agencies should focus on structuring reports with insights that actually matter, not just a data dump.
That means highlighting key metrics, trends, and areas for improvement in a way that’s easy to digest. Skip the filler, add context to the numbers, and include recommendations that help clients make informed decisions. A few well-placed visuals can go a long way in making reports clearer and more actionable.
1. Monthly Reports
Monthly reports should provide a snapshot of short-term trends:
Summary of engagement, reach, and conversion metrics.
Top-performing posts and why they worked.
Insights on audience growth and behavior.
Key recommendations and next steps.
2. Quarterly Reports
Quarterly reports should focus on broader trends and insights:
Performance trends over the last three months.
Competitor benchmarking.
Changes in audience sentiment and engagement patterns.
Strategy shifts based on data insights.
3. Year-End Reports
Year-end reports should be comprehensive, analyzing overall performance:
Growth and engagement trends across the year.
ROI assessment - how social media contributed to business goals.
Campaign successes and failures with key learnings.
Strategic recommendations for the upcoming year.
Downloadable Template
We have put together a downloadable template that is designed keeping agencies in mind.
Make sure you have a basic Canva account to be able to make any necessary changes to the document. We also recommend to click on ‘Use template for new design’ while trying to make any changes.
Template Reccomendations
Smartsheet
Smartsheet offers a variety of free templates in formats like Excel, Word, PowerPoint, PDF, and Google Slides. Their Annual Social Media Report Template provides a dashboard-style overview, highlighting key performance metrics such as fan counts, page views, and user interactions. These templates are versatile and can be adapted for monthly, quarterly, or annual reporting.
AgencyAnalytics provides a free, customizable social media report template designed to streamline client reporting. The template includes a branded cover page, a monthly social media report summary, and integrates with Google Analytics to showcase social performance. It's particularly useful for agencies looking to reduce reporting time and enhance professionalism.
Template.net offers a range of professionally designed social media report templates that are fully customizable and printable. Options include monthly, quarterly, and annual report formats, catering specifically to agencies. These templates are available in various formats, including Word and Google Docs, allowing for easy editing and adaptation.
✅Every report should start with a solid foundation of key metrics. These are the numbers that actually matter - organic traffic, keyword rankings, click-through rates, domain authority changes, and conversions from search. Depending on the client’s focus, you may also need to track things like engagement metrics (bounce rates, time on site, pages per session), backlink growth, and technical improvements like page speed optimizations.
✅Month-over-month and year-over-year comparisons help put performance into perspective. Instead of showing traffic for a single period, highlight how it has changed over time and why. If rankings improved, what was done to contribute to that? If traffic dropped, was there an algorithm update, a technical issue, or a competitor making aggressive moves? Trend analysis adds context to the numbers and prevents the report from feeling like just a data dump.
✅Numbers without insights don’t mean much. The report should highlight what’s working, what needs improvement, and any major observations from the data.
✅A well-structured report is just as important as the data itself. Stick to clean, professional formatting that’s easy to read. Use a readable font (serif or sans-serif) and a limited color palette, ideally one or two main colors that align with the client’s branding. Graphs and charts should be simple and visually clear, ensuring they enhance the report rather than cluttering it. White space, bullet points where necessary, and a logical flow all contribute to a polished, digestible report.
✅Accuracy and reliability are everything, so the report should pull data from trusted sources like Google Analytics, Google Search Console, Ahrefs, SEMrush, Moz, or other industry-standard SEO tools. If using multiple sources, ensure consistency in reporting metrics to avoid discrepancies. For better visualization, tools like Google Data Studio or AgencyAnalytics can help present data in an interactive and client-friendly way.
Summing it up…
Social media reporting isn’t just about throwing numbers into a document, it’s about making sense of the data and showing clients what’s actually working. A solid report should highlight key wins, flag areas that need attention, and tie everything back to their business goals. The clearer and more actionable it is, the more valuable it becomes.
With the right approach (and a good template), reporting stops being a tedious task and turns into something that drives real conversations and strategy shifts. Grab the template, streamline your process, and start putting together reports that actually make an impact.
Social Media Reporting Guide For Marketing Agencies + Downloadable Template: FAQs
What is the 50/30/20 rule for social media?
The 50/30/20 rule is a content strategy framework that helps balance your social media posts. It suggests that 50% of your content should be informative or educational, 30% should engage your audience (think interactive posts, discussions, or user-generated content), and 20% should focus on promotions or sales. This approach keeps your feed from feeling overly salesy while still driving conversions.
How to do a social media marketing report?
A solid social media marketing report should highlight key performance metrics, audience engagement, and overall impact. Start with a high-level summary, followed by detailed insights on reach, engagement, conversions, and content performance. Visuals like charts and graphs help break down the data, and wrapping up with actionable recommendations keeps the report useful.
What are the 5 pillars of social media marketing?
The five pillars of social media marketing are strategy, planning and publishing, engagement, analytics, and advertising. Strategy sets the foundation,defining goals, audience, and content themes. From there, it’s about consistent posting, building conversations, tracking performance, and amplifying reach through paid efforts.
What are the 7 layers of social media analytics in data analytics?
The seven layers of social media analytics break down into descriptive, diagnostic, predictive, and prescriptive analytics, followed by sentiment analysis, competitive benchmarking, and ROI tracking. Descriptive and diagnostic tell you what’s happening and why, predictive and prescriptive help forecast trends and optimize strategies, while sentiment analysis gauges audience perception. Competitive benchmarking keeps you in check with industry trends, and ROI tracking ties everything back to business impact.

.svg)
.webp)